Performance Profiler tools
SD supplies performance profiling tools for arbitrary procedural languages. Such tools provide statistics about the execution frequency of parts of a program, both absolute and relative. This information is invaluable in tuning a program for peak performance. Profile information is collected for every basic block in the program, which gives the same information as profiling every statement with significantly lower overhead.
SD provides two kinds of profilers:
- Counting Profilers: These tools insert language-specific probes for each basic block in the source files of interest before compilation/execution. At execution time, the probes count each execution of the block ("profiling data").
- Timing Profilers:These tools insert langauge-specific probes to capture the timing of individual functions, both including and excluding all called subfunctions, and the call tree for the particular program execution.
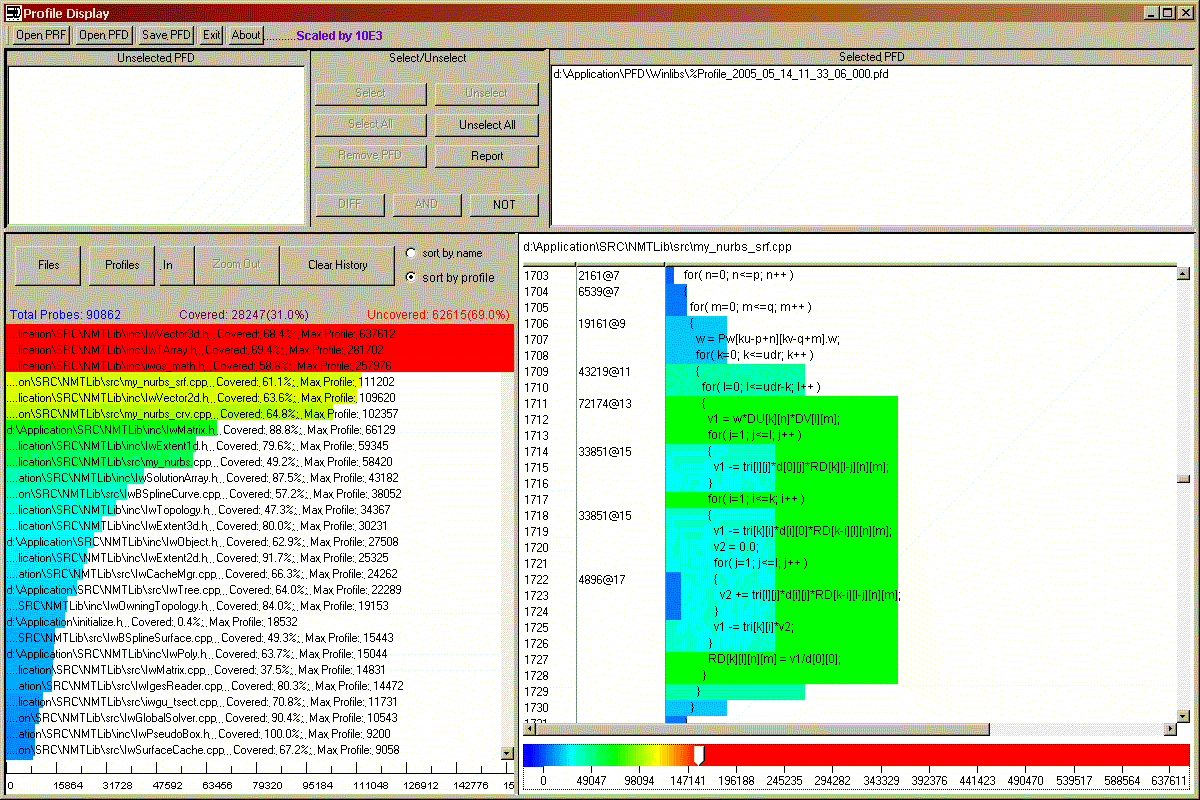
On completion of execution, the in-memory profile data is typically written to a profile data file. Finally, the profile data is displayed on top of browsable source text of the software, both color- and size- coded (hot is red and wide, cold is blue) enabling a performance engineer to easily see what part of the code is the bottleneck. For the timing profiler, a separate display of the call graph with timings is provided.

Typical Features
- Not dependent on any particular compiler or object formats
- Works with tens of thousands of files
- View by frequency or subsystem
- Profile data is shown by count, percentage, color and bar width
- Very low probe overhead (one or two machine instructions per executed probe)
- Can accumulate profile data from multiple execution runs
- Browsable source files overlayed with collected profile information
- Produces profile report by application, subsystem and file
- Can operate with custom/embedded application execution environments
- Consistent style and operation across different languages
- Probe installer and display tool operate on Windows 2003, XP, and later operating systems
- Application under test can execute in arbitrary native enviroment including embedded systems
Available for the following languages
- Java: client, Server (J2EE), embedded, and RealTime Java
- C
- C++
- C#
- COBOL
- PHP
- PARLANSE (yes, we use our own tools!)
Semantic Designs also provides test coverage tools.
Unusual Requirements?
Your language not listed, runs in an unusual environment, or you have some custom need? SD can configure a profiling tool for you! These tools are based on DMS, and inherit DMS's language agility and scalability. A white paper on how profiling is implemented with DMS is available: TestCoverage.pdf
