Java Profiler Tool
The Java Profiler tool enables the collection and display of execution profile data on Java software source code bases of arbitrary size. It is a member of SD's family of Profiler tools.
Java Profiler Features
- Java1 and Java2 compatible, covering Java 1.1 to 1.6
- Provides execution counts on basic blocks, or timing profiles on methods
- Works with standalone applications or servlets
- Works with applications runninng on arbitrary JVMs (including embedded systems) or RealTime Java
- Works with arbitrary subsets of source code base
- Can accumulate data from multiple test runs
- Handles
tens of thousands of files - Extremely low probe overhead
- Complete control over which Java class files are profiled (profiling tools using JVM facilities often must collect information for every class regardless of your interests)
- Produces profile report by application, package and file
- The probe installer component runs on Windows
- Profile data display can run on any platform with a full JVM
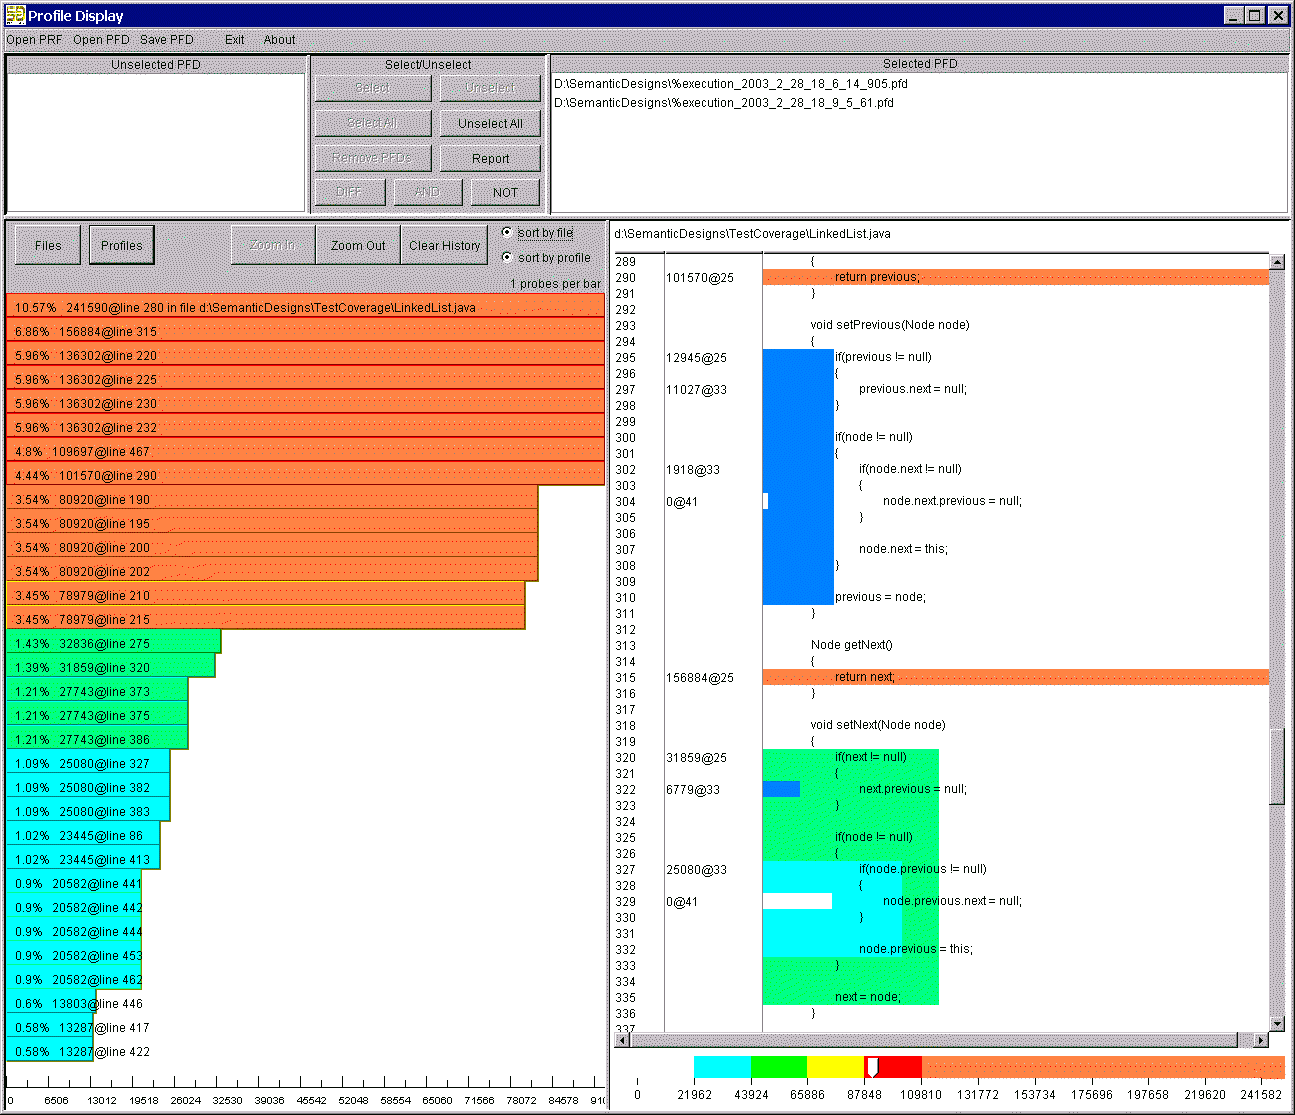
The Java Profiler tool has an intuitively simple display. It shows
- Available Profile Data (PFD) result files
- Selected/accumulated/computed PFD files
- List of files for which profile data is being collected
- Locations of probe points in files
- Browsable source text of file of current interest
- Execution counts and relative execution frequency of each probe point on file source text
- Color- and size- coded (hot is red and wide, cold is blue) overlay of frequency data on source code
- Summary statistics for subsystems

Here's a full size screenshot (in a popup window) of the Java Profiler display. If you have popups disabled, try this link: full size screen shot
The extremely low space and time overhead of test probes used by the Java Profiler tool makes it ideal for working with embedded or realtime programs.
Semantic Designs also offers Java Test Coverage tools
