C# Test Coverage Tool
The C# Test Coverage tool enables the collection and display of code coverage data on C# software source code bases of arbitrary size. It is a member of SD's family of Test Coverage tools.
C# Test Coverage Features
- Handles full C# 2/3/4/4.5/5/6
- Independent of platform (works with Microsoft tools, Mono)
- Works on server applications, workstation applications, DLLs and embedded devices (Windows CE, and WinRT)
- Works with arbitrary subsets of source code base
- Can accumulate data from multiple test runs
- Handles
tens of thousands of files - Extremely low probe overhead
- Operations to combine Test Coverage data for unions, deltas, intersections
- Incremental insertion of probes
- Incremental reporting of which test cases need to be re-run based on code changes at the method level
- Produces coverage report by application, subsystem and file
- The probe installer component runs on Windows
- Test Coverage data display can run on any platform with a full JVM
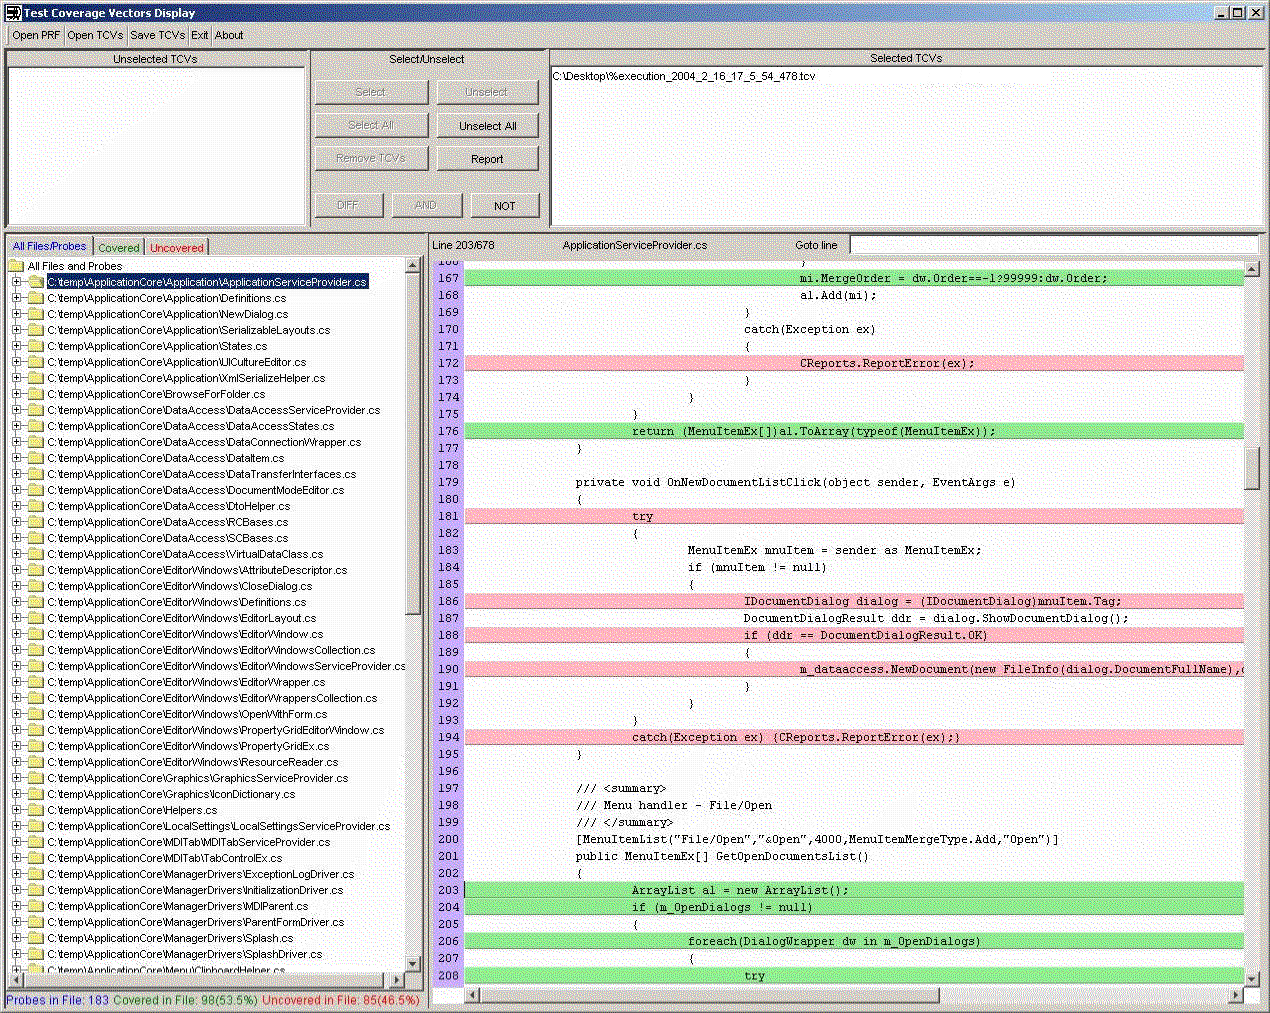
The C# Test Coverage tool has an intuitively simple display. It shows
- Possible test coverage vector (TCV) result files
- Selected/accumulated/computed TCV files
- List of files being tested for coverage
- Locations of probe points in files
- Browsable source text of file of current interest
- Covered/uncovered status of each probe point on file source text
- Summary statistics for percentage covered

Here's a screenshot (in a popup window) of the C# Test Coverage display. If you have popups disabled, try this link: screen shot
Semantic Designs also offers C# Profiler Tools
