C# Profiler Tool
The C# Profiler tool enables the collection and display of execution profile data on C# software source code bases of arbitrary size. It is a member of SD's family of Profiler tools.
C# Profiler Features
- Provides execution counts on basic blocks, or timing profiles on methods
- Works with arbitrary subsets of source code base
- Works with stand-alone applications or C#-based DLLs
- Can accumulate data from multiple test runs
- Handles
tens of thousands of files - Extremely low probe overhead
- Produces profile report by application, subsystem and file
- The probe installer component runs on Windows
- Profile data display can run on any platform with a full JVM
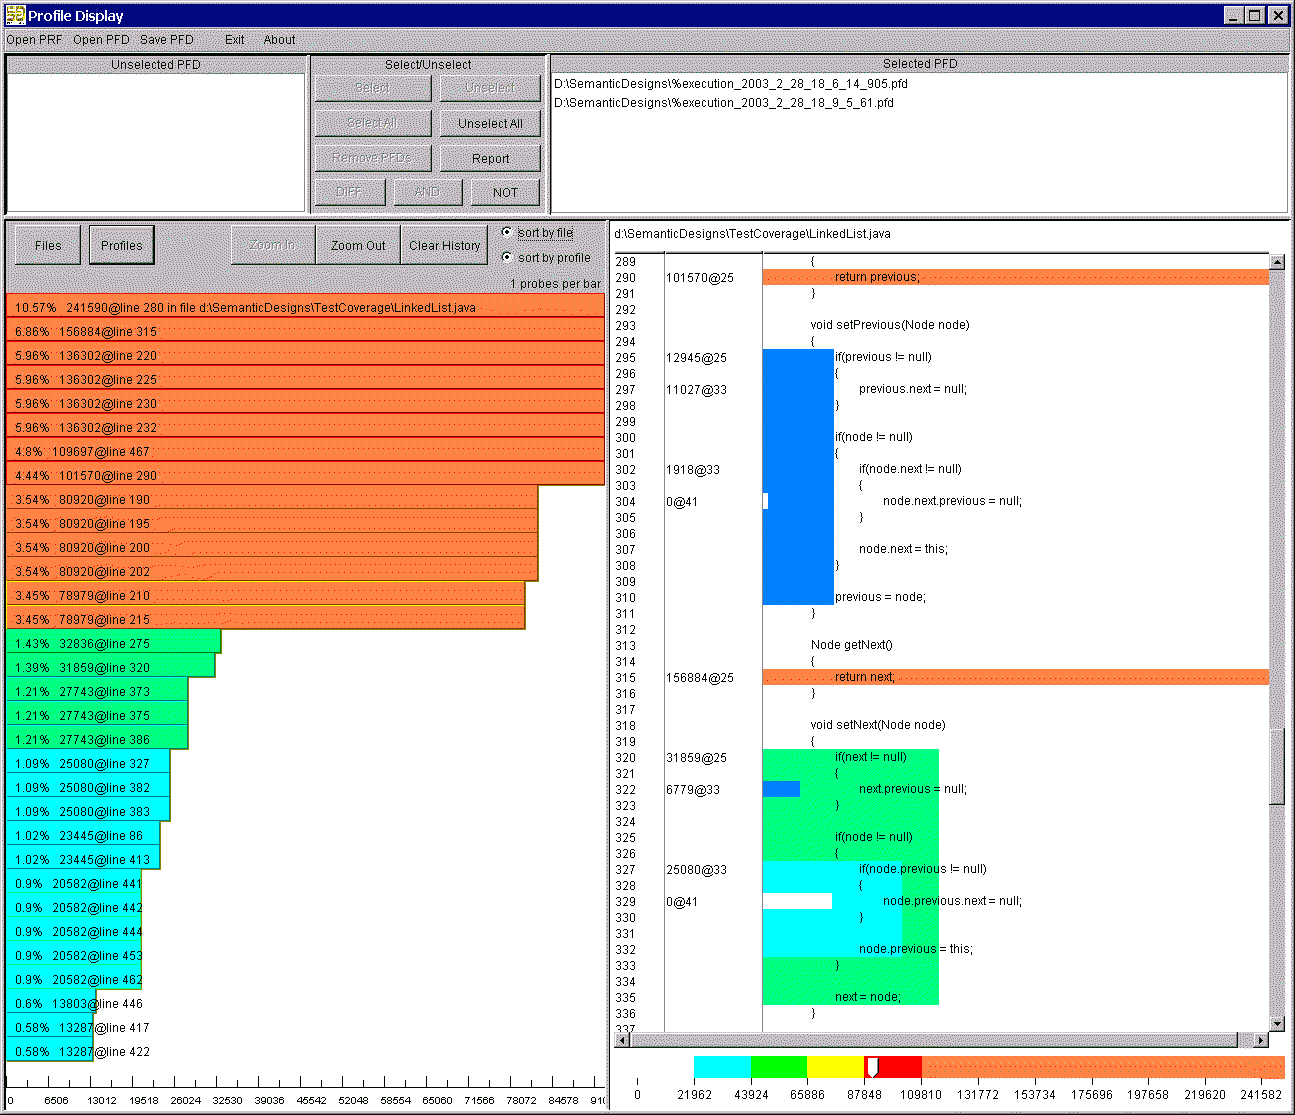
The C# Profiler tool has an intuitively simply display. It shows
- Available Profile Data (PFD) result files
- Selected/accumulated/computed PFD files
- List of files for which profile data is being collected
- Locations of probe points in files
- Browsable source text of file of current interest
- Execution counts and relative execution frequency of each probe point on file source text
- Color- and size- coded (hot is red and wide, cold is blue) overlay of frequency data on source code
- Summary statistics for subsystems

Here's a full size screenshot (in a popup window) of the C# Profiler display. If you have popups disabled, try this link: full size screen shot
Semantic Designs also offers C# Test Coverage tools
